Open source Visualization infrastructure
Bronto Annotations
Explain existing charts, diagrams, and interfaces through geometry-aware annotations.
A DOM-independent TypeScript engine that decides where explanatory notes should go, how their connectors should route, and whether their placements overlap the underlying content. The host keeps control of its rendering, data, and state.
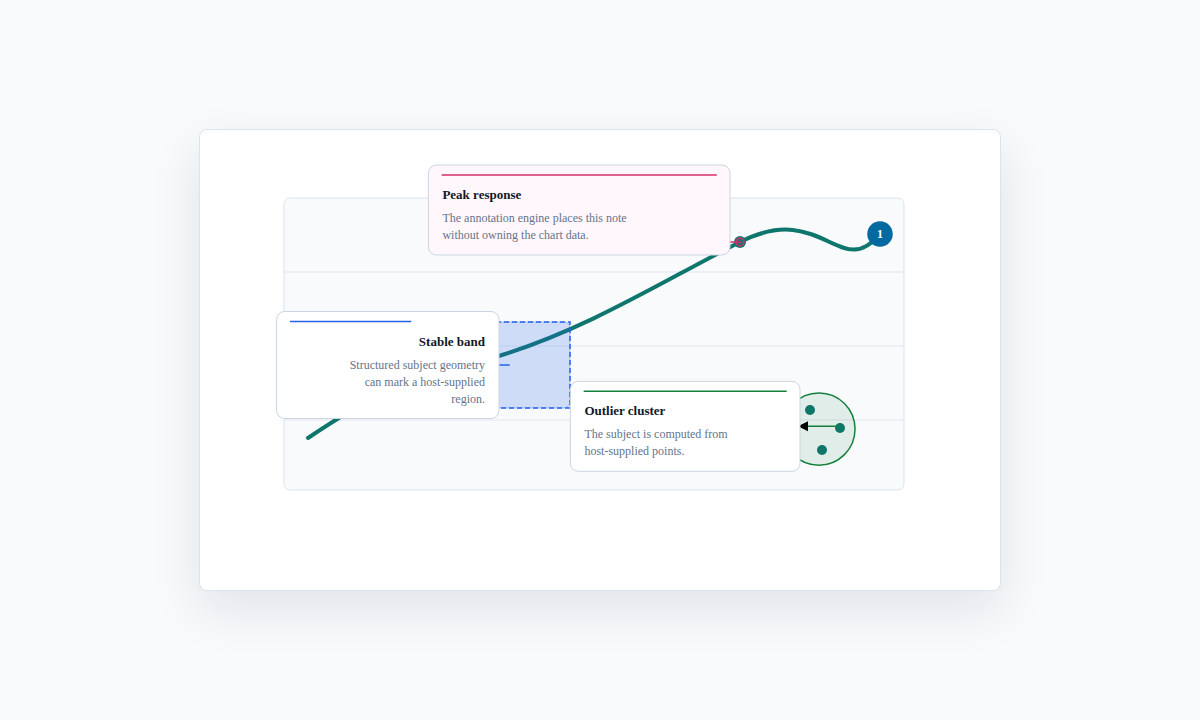
Why it exists
Charts and diagrams often need editorial context, but handwritten callout coordinates are brittle when content or layout changes. Bronto Annotations makes those choices explicit: anchors, possible placements, connector paths, obstacles, and a report on layout quality.
The package draws inspiration from Susie Lu's annotation work and takes the ideas into a DOM-free TypeScript core with optional integration adapters.
How it works
Host applications supply point or box geometry. A deterministic layout engine searches candidate positions, scores collisions, and generates connector paths. SVG and React renderers consume the same annotation data model.
Optional adapters support Vega, Mermaid, D2, React Flow, and measured DOM regions. Styling remains independent: a Bronto-compatible stylesheet is available without making Bronto UI a runtime dependency.
Different hosts, shared annotation rules
The same layout model applied to generated diagrams and data visualizations.
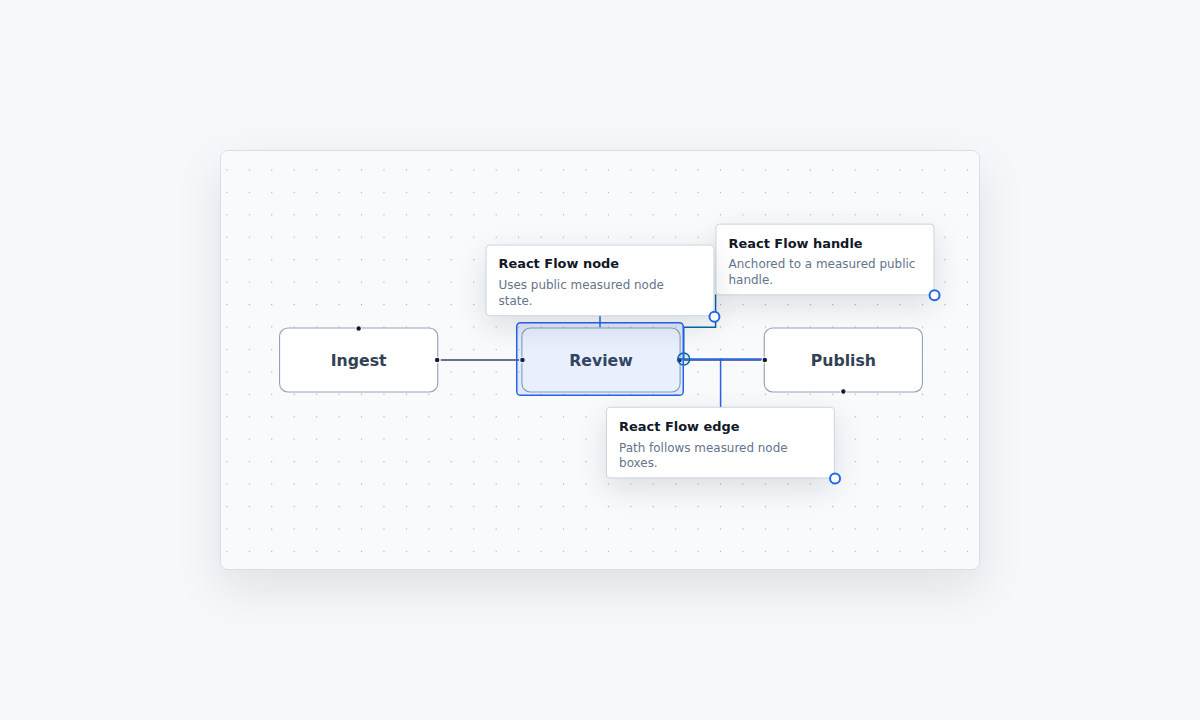 React Flow
 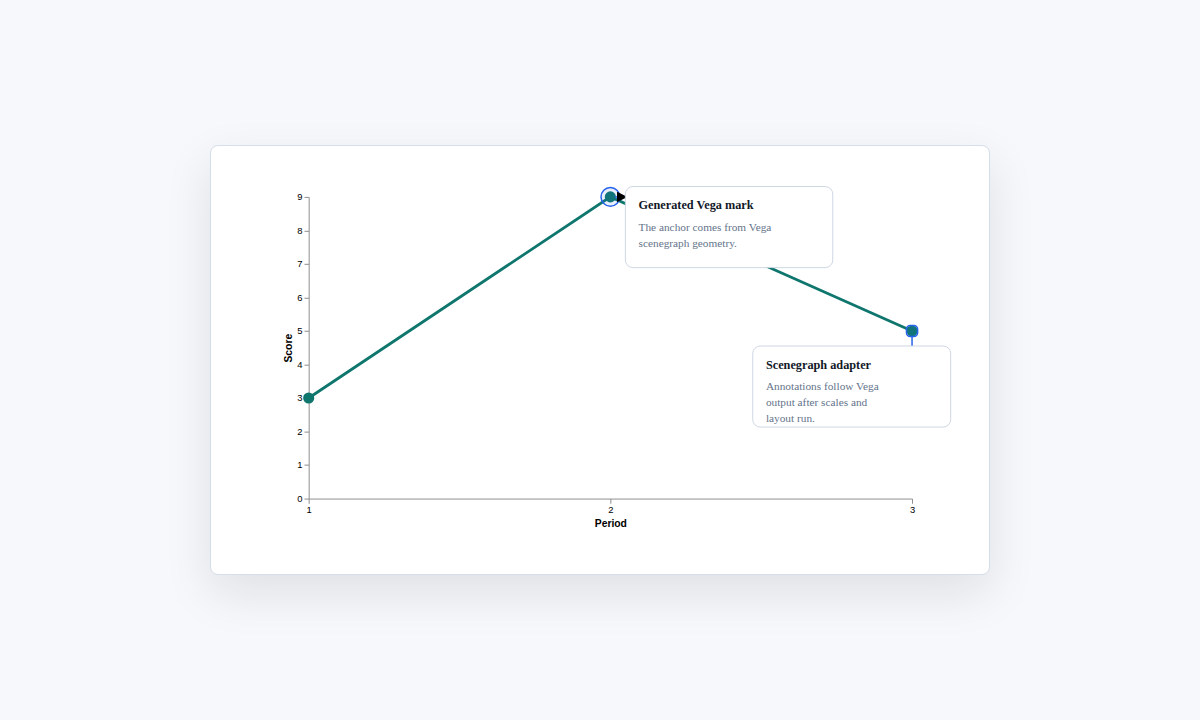 Vega
Vega Bronto Annotations is pre-1.0 open-source software, available under the MIT license.
Visit the project website